Sparrow On-Demand UI Kit
The Sparrow On-Demand UI Kit is a React-based UI component library that helps you integrate the Sparrow On-Demand APIs with ease. Developers can use the Sparrow On-Demand UI Kit to quickly implement features such as viewing the analysis request list and the analysis results.
⚙️ Installation
- Install the UI Kit using the following command.
yarn add @sparrowai/ondemand-uikit
Tip: Sparrow OnDemand UI Kit version 1.1.3 is supported.
- Install the peerDependencies.
yarn add @hookform/resolvers @tanstack/react-table react-hook-form
Tip: If they are already installed, you do not need to install them again.
🍭 Implementing the UI Kit
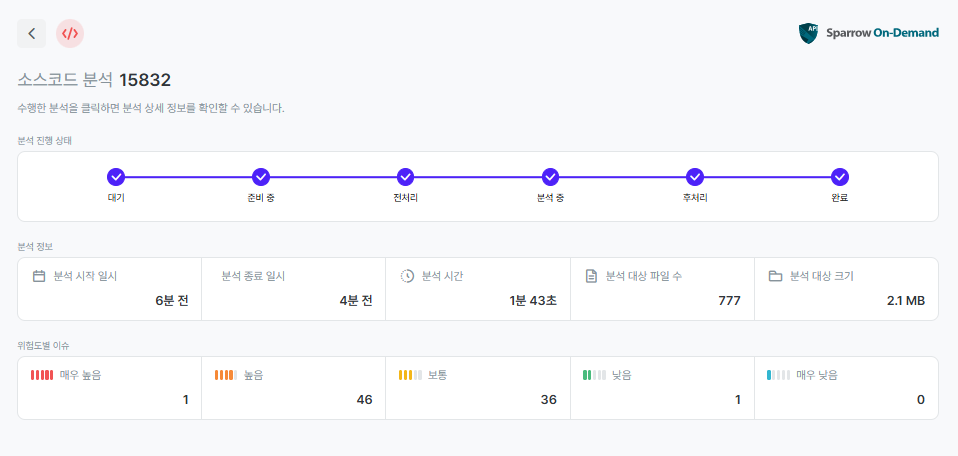
The Sparrow OnDemand UI Kit supports two components, Analysis request and Analysis list, as shown below. These components are provided as page templates, and the UI they contain cannot be changed.
Analysis request component
A UI component you can use when requesting an analysis.
- Create the Sparrow On-Demand UI Kit client using the following code.
import { useState } from "react";
import {
  OndemandClient,
  OndemandClientConfig,
  SparrowAnalysisRequest,
  SparrowOnDemandProvider,
  SparrowAnalysisResult,
} from "@sparrowai/ondemand-uikit";
import "@sparrowai/ondemand-uikit/style.css";

function App() {
  const config = new OndemandClientConfig({
    apiKey:"API_KEY"
  });


  const [client] = useState<OndemandClient>(() => {
    return new OndemandClient(config);
  });

  return (
    <SparrowOnDemandProvider client={client}>
      <SparrowAnalysisRequest />
    </SparrowOnDemandProvider>
  );
}
Tip: Change the properties below as appropriate.
apiKey
The token issued by Sparrow On-Demand and used for authentication in API requests (API_KEY).
- Run the application and check that the analysis request component is displayed correctly.
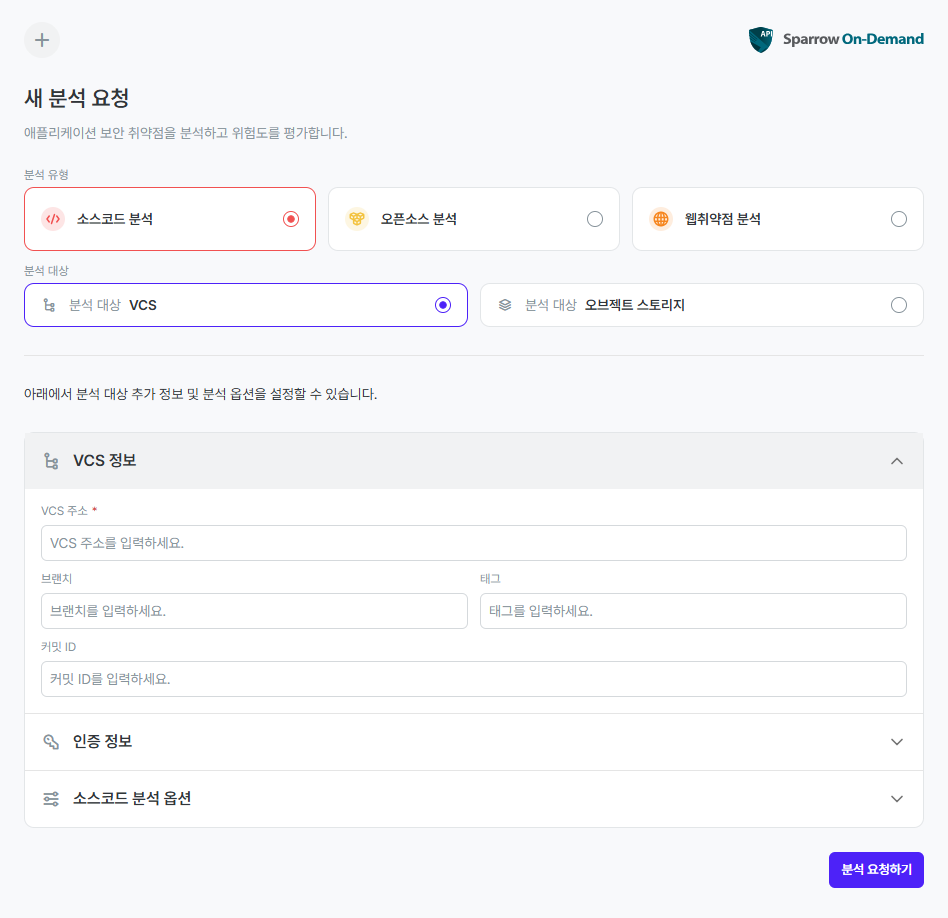
- Referring to the following, enter the required information in the analysis request component and request the analysis.
Analysis type
Select the type of analysis. You can select one of source code analysis, open source analysis, and web vulnerability analysis.
Analysis target
Select the analysis target. For source code analysis and open source analysis, you can select either a VCS repository or object storage. For web vulnerability analysis, enter a URL.
VCS repository
VCS information If you selected a VCS repository, enter the repository URL, branch, commit ID, and tag.
Tip: If you do not enter a branch, commit ID, or tag, the files in the most recent commit of the default branch are analyzed. If you enter two or more values, the priority applied is branch, commit ID, tag.
Credentials Enter the credentials for accessing the VCS repository. You can select either a user ID and password, or a user ID and token.
Object storage
Object storage information If you selected object storage, enter the storage type, endpoint, bucket, and object name.
Credentials The credentials for accessing the object storage. Enter the access key and secret key.
Analysis target URL If you selected web vulnerability analysis, enter the target URL to be analyzed.
When the analysis request is sent successfully, a confirmation message is displayed.
Users can control the analysis behavior in detail through analysis options. The following are the main options supported for each analysis type.
Source code analysis options
-
Maximum source size The maximum size of the analysis target to be inspected in a source code analysis or an open source analysis. If the size of the analysis target downloaded while the source code analysis or open source analysis is running is larger than the number you enter, the analysis ends. You can enter an integer between
1and200.(Unit: MB) -
List of file extensions to analyze A source code analysis distinguishes the files to include in the analysis target by extension. If the extension of an archive file is part of the analysis target, all files inside the archive are included in the analysis. For source code analysis, files that do not match are excluded from the analysis.
-
Paths excluded from analysis If there are files you want to exclude from the analysis, enter the paths of those files (EXCLUDED_PATH1, EXCLUDED_PATH2, EXCLUDED_PATH3). No issues are detected from files under the paths entered here.
Open source analysis options
-
Maximum source size
The maximum size of the analysis target to be inspected in a source code analysis or an open source analysis. If the size of the analysis target downloaded while the source code analysis or open source analysis is running is larger than the number you enter, the analysis ends. You can enter an integer between
1and200.(Unit: MB) -
SBOM type list The SBOM types you want to receive. If the list is empty, no SBOM is generated. You can enter the following values.
- SPDX 2.2:
SPDX22(.spdx),SPDX22_JSON(.json),SPDX22_SPREADSHEET(.xlsx),SPDX22_RDF(.rdf) - SPDX 2.3:
SPDX23(.spdx),SPDX23_JSON(.json),SPDX23_SPREADSHEET(.xlsx),SPDX23_RDF(.rdf) - SPDX 3.0:
SPDX30_JSON(.json) - CycloneDX:
CycloneDX14,CycloneDX15,CycloneDX16(.json) - SWID:
SWID(.zip) - NIS SBOM:
NIS_CSV(.csv),NIS_PDF(.pdf),NIS_JSON(.json)
- SPDX 2.2:
-
SBOM creator
-
SBOM creator email
Web vulnerability analysis options
-
Analysis target URL The URL to be analyzed, and only one can be entered. When you enter the analysis target URL, you must confirm that the URL is reachable from the external internet and that no firewall is active on that server.
-
Login record file list A login record file is a file in .ecl format saved from the Event Clipboard that records the user's actions on a specific URL. It is mainly used when crawling or analyzing URLs, by storing the ID and password information the user used to log in on a specific URL.
When you attach a login record file, if the crawler or analyzer reaches the URL at which the Event Clipboard recording started, the user actions stored in that file are replayed exactly. This lets you pass the authentication required on a login page.
- Download the Sparrow Event Clipboard and save your login process as a file to use it.
-
Crawl sub-paths only Crawl sub-paths only indicates whether to crawl only the paths that contain the entire analysis target URL entered in the project. If you set this option to
Yes, only the sub-paths that include the analysis target URL are analyzed. If you set this option toNo, the parent paths that contain the project's analysis target URL are also analyzed. -
Client language Sets the language configured in the browser in which the web application under analysis is displayed, and which language the HTTP client can understand. You can enter it in the locale format shown as Language.(Default:
ko) -
Maximum number of crawled URLs Maximum number of crawled URLs is the maximum number of URLs that can be crawled in the analysis. If too many URLs are crawled, the analysis results may not be accurate. Therefore it is a good idea to specify the maximum number of URLs to crawl in this option.(Default:
0)The larger the value entered in this option, the more URLs that can be crawled, but the analysis time required for crawling can also increase. The smaller the value entered, the fewer URLs that can be crawled and the shorter the analysis time. If you enter nothing, the default value of the option is
0, in which case the number of URLs that can be crawled is not limited. -
Maximum crawl time Maximum crawl time is the maximum amount of time URLs can be crawled in the analysis. If it takes too much time, the analysis results may not be accurate. Therefore it is a good idea to specify the crawl time in this option.(Unit: minutes, default:
0)The larger the value entered in this option, the longer the analysis time for crawling and the more URLs that can be crawled. The smaller the value entered, the shorter the analysis time and the fewer URLs that can be crawled. If you enter nothing, the default value of the option is
0, in which case the crawl time is not limited. -
Maximum analysis time Maximum analysis time is the maximum amount of time URLs can be analyzed in the analysis. If it takes too much time, the analysis results may not be accurate. Therefore it is a good idea to specify the analysis time in this option.(Unit: minutes, default:
0)The larger the value entered in this option, the longer the analysis time and the more analysis results. The smaller the value entered, the shorter the analysis time and the fewer analysis results. If you enter nothing, the default value of the option is
0, in which case the analysis time is not limited. -
URLs excluded from crawling URLs excluded from crawling refers to a list of strings such that, if a URL contains a specific word, that URL is skipped and not crawled. You can enter one or more strings, separated by Enter or a comma (,).
If even one of the words in the list entered in this option is contained in a URL to be crawled, that URL is not crawled. Note, however, that because the URL is skipped right before it would be crawled, the browser may still visit that URL.
-
URLs excluded from analysis
URLs excluded from analysis refers to a list of strings such that, if a URL contains a specific word, that URL is skipped and not analyzed. You can enter one or more URLs, separated by Enter or a comma (,).
If even one of the words in the list entered in this option is contained in a URL to be analyzed, that URL is not analyzed.
Tip: If you want to exclude a page's behavior from the analysis rather than the entire page shown by the URL, use the Elements excluded from event execution option below.
-
Excluded URL suffixes
Excluded URL suffixes refers to a list of suffixes such that, if a specific word or extension appears at the end of a URL, that URL is skipped and not crawled. Enter them in the extension format starting with a period (.), separated by Enter or a comma (,).(Default:
.js .jsx .ts .tsx .css .xml .jpg .jpeg .gif .bmp .png .ico .wma .wav .mp3 .wmv .avi .mp4 .mov .exe .zip .tar .tar.gz .7z .doc .xls .ppt .docx .xlsx .pptx .pdf .txt .csv .jar .eot .woff2 .woff .ttf .otf .apk .hwp .svg .msi)If even one of the words in the list entered in this option is included at the end of a URL to be crawled, that URL is not crawled. Because the URL is skipped by checking HTML element attribute values and the like before navigating to it, that URL is never visited, so it can be skipped before actions such as file downloads are performed.
-
Elements excluded from event execution (CSS selector)
Elements excluded from event execution (CSS selector) is a list of CSS selectors representing the HTML elements that the browser should not fire events on during URL crawling, excluding them from event execution. Enter one or more values as strings, separated by Enter or a comma (,).
If even one of the CSS selectors in the list entered in this option is present on the page, no events are fired on the matching HTML element or its child HTML elements. This lets you configure the page so that a logout button is not clicked.
- Additional elements for event execution (CSS selector)
Additional elements for event execution (CSS selector) is a list of CSS selectors representing the HTML elements on which events are always fired during URL crawling, even if they are not among the HTML elements that normally support event execution. Enter one or more values as strings, separated by Enter or a comma (,).
If even one of the CSS selectors in the list entered in this option is present on the page, all events on the matching HTML element and its child HTML elements are fired. This lets you fire events on elements such as tags that are not normally included in event execution.
-
Elements excluded from event execution (XPath)
Elements excluded from event execution (XPath) is a list of XPaths representing the HTML elements that the browser should not fire events on during URL crawling, excluding them from event execution. Enter one or more values as strings, separated by Enter or a comma (,).
If even one of the XPaths in the list entered in this option is present on the page, no events are fired on the matching HTML element or its child HTML elements. This lets you configure the page so that a logout button is not clicked.
-
Additional elements for event execution (XPath)
Additional elements for event execution (XPath) is a list of XPaths representing the HTML elements on which events are always fired during URL crawling, even if they are not among the HTML elements that normally support event execution. Enter one or more values as strings, separated by Enter or a comma (,).
If even one of the XPaths in the list entered in this option is present on the page, all events on the matching HTML element and its child HTML elements are fired. This lets you fire events on elements such as tags that are not normally included in event execution.
-
Custom HTTP headers
Custom HTTP headers refers to the list of header names and values included in the HTTP requests sent when crawling URLs. If you enter a header name and value in this option, that header is added to every HTTP request message. Click the Add button to add one or more headers, and click the trash icon to delete them.
In this option you must enter the headers that are strictly required for the HTTP request. This configures a proxy in the browser, so crawling speed may become slower.
Except for the
Cookieheader, if you enter several headers with the same name, only one of them is applied. Therefore, if you need to enter multiple values, separate the header values with;. If a header with the same name already exists, that header is removed and the custom header is added. To use custom headers, the host of the analysis target URL must not be set tolocalhostor127.0.0.1. If you want to analyze a web application running locally, you must enter the local IP address. -
URL crawl depth
URL crawl depth means how far the URL to crawl is from the start URL, and is distinguished as
high,medium, orlow. The farther a URL is, the more minimum actions, such as page navigations, are required to reach that URL from the start URL.(Default:medium)If you set this option to
high, URLs far from the start URL are also crawled, but crawling takes longer. If you set this option tolow, the time spent crawling URLs in the project is shorter, but URLs that are far away are not crawled. -
DOM crawl depth
DOM crawl depth means how far the DOM to crawl is from the first DOM created at the same URL, and is distinguished as
high,medium, orlow. The farther a DOM is, the more minimum actions are required to reach that particular DOM of the same URL from the first DOM.(Default:medium)If you set this option to
high, DOMs far from the first DOM created when navigating to the URL are also crawled, but crawling takes longer. If you set this option tolow, the time spent crawling DOMs in the project is shorter, but DOMs that are far away are not crawled.- Event wait time
Event wait time refers to the time to wait for the result of each event execution to be reflected in the DOM. You can enter a number between
0and5000, and if you do not enter this option, the default is300.(Unit: milliseconds, default:300) -
Number of requests
Number of HTTP requests refers to the number of HTTP requests that can be sent per second when crawling URLs. You can enter a number between
-1and10000, and if you do not enter this option, the default is-1, in which case the number of HTTP requests that can be sent is not limited.(Unit: count, default:-1)The larger the value entered in this option, the more HTTP requests can be sent per second, speeding up URL crawling, but the increased traffic volume can also increase the load on the web application server being analyzed. The smaller the value entered, the lower the traffic volume and the lower the load on the web application server being analyzed, but URL crawling becomes slower.
-
HTTP client wait time
HTTP client wait time refers to the maximum time to wait when a delay occurs while the HTTP client connects to the web server to perform the analysis, sends the HTTP request, and receives the HTTP response. You can enter a number between
0and30000, and if you do not enter this option, the default is3000.(Unit: milliseconds, default:3000)The larger the value entered in this option, the more the analysis proceeds normally even when a delay occurs because the network connection to the web server is poor. However, if disconnections from the web server occur repeatedly, the analysis time is likely to increase. The smaller the value entered in this option, the faster the analysis, but there is a greater chance that a URL cannot be analyzed if a delay occurs because the network connection to the web server is poor.
Analysis list component
A UI component you can use when reviewing analyses. If you click an item in the analysis list, you can see more detailed summary information.
- Create the Sparrow On-Demand UI Kit client using the following code.
import { useState } from "react";
import {
  OndemandClient,
  OndemandClientConfig,
  SparrowAnalysisRequest,
  SparrowOnDemandProvider,
  SparrowAnalysisResult,
} from "@sparrowai/ondemand-uikit";
import "@sparrowai/ondemand-uikit/style.css";

function App() {
  const config = new OndemandClientConfig({
    apiKey:"API_KEY"
  });


  const [client] = useState<OndemandClient>(() => {
    return new OndemandClient(config);
  });

  return (
    <SparrowOnDemandProvider client={client}>
      <SparrowAnalysisResult />
    </SparrowOnDemandProvider>
  );
}
Tip: Change the properties below as appropriate.
apiKey The token issued by Sparrow On-Demand and used for authentication in API requests (API_KEY).
- Run the application and check that the analysis list component is displayed correctly.
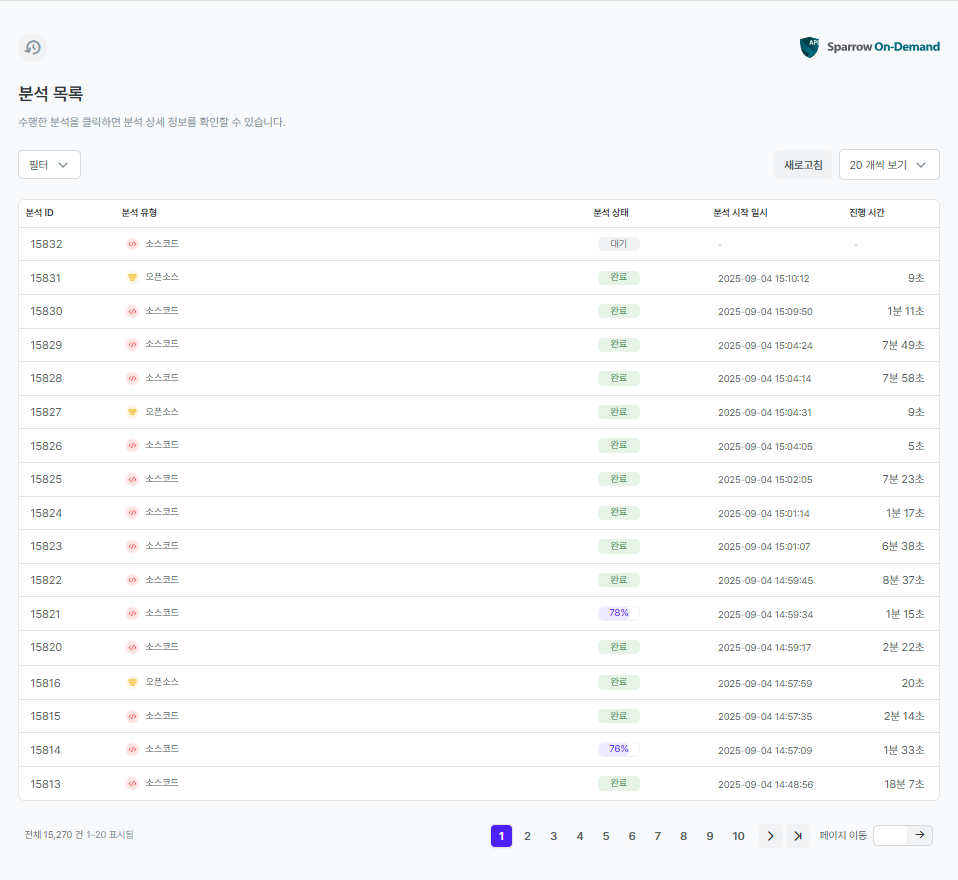
Tip: The analysis list shows every analysis accessible with the API key you entered. If there are no analyses, use the Analysis request component to request one.
- Click an item in the analysis list to check the analysis details.